
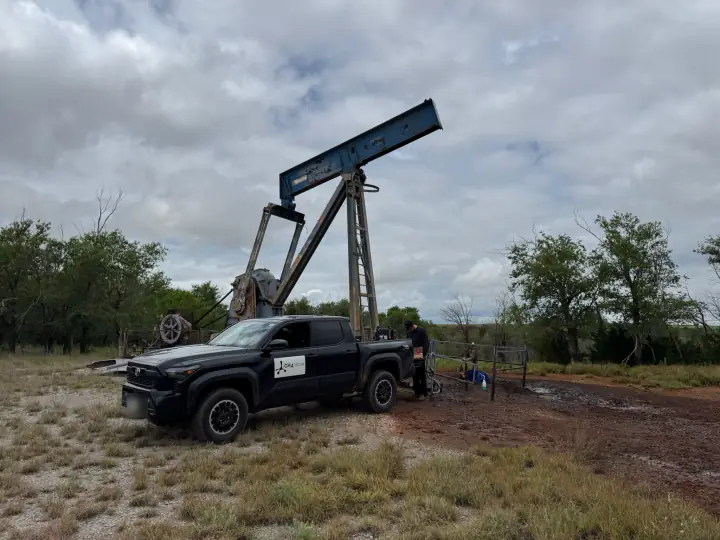
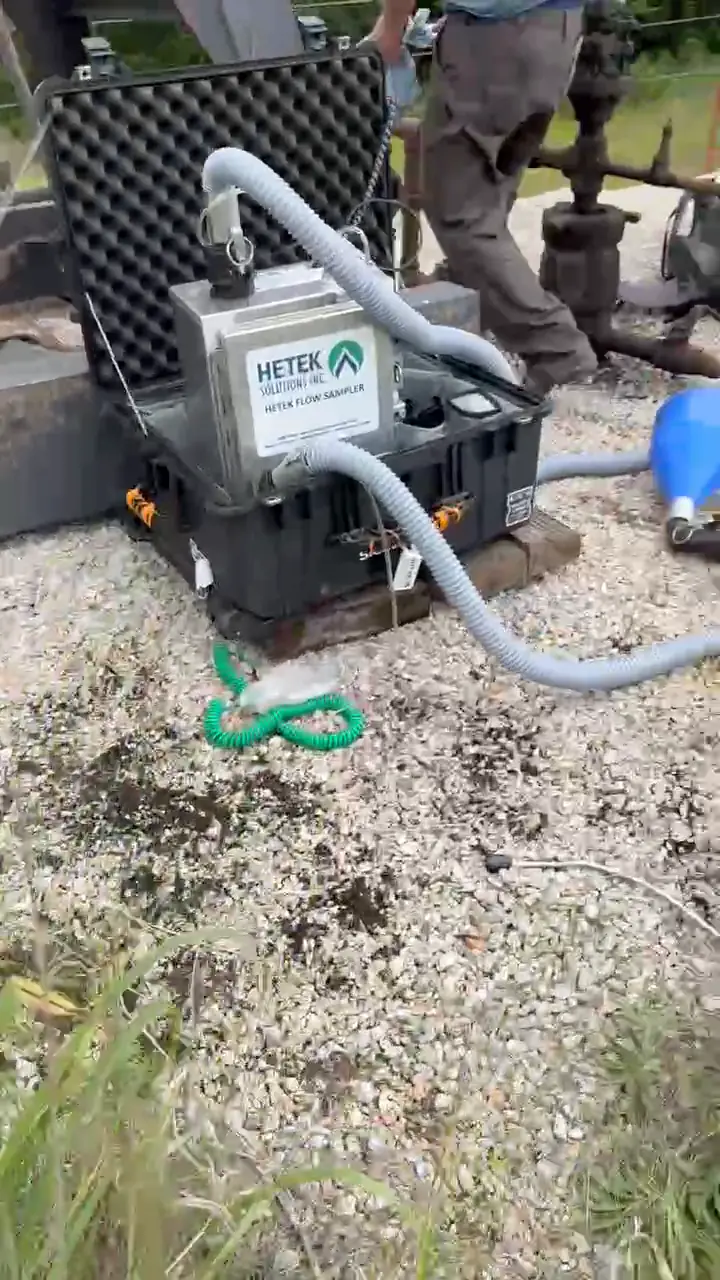
Between May 2025 and early October 2026, our crews tested 1,042 orphaned wells in Oklahoma on discovery surveys and found 74 of them leaking, about 7%. Every well was screened as found with a handheld methane detector, with nothing on it opened, turned or pressurized. Where there was a leak, we sealed a high-flow sampler over the leak point and measured it. When a leak was too small for the sampler to register, we recorded it as a small leak without a rate.
Seventeen wells hold most of what we measured
Of the 1,042 wells in that cohort, 17 hold 80% of the methane, and 8 hold half of it. That includes 39 small leaks that the crew found by bubbling, hissing or smell but that were too small for our samplers to put a rate on, and they count here as zero. If each of them leaked as much as 5 litres a minute, 27 wells would hold 80% of the methane, about 2.6% of the wells tested.
17of 1,042 tested Oklahoma wells hold 80% of the methane
Most of that concentration comes from a plainer fact: 93% of the wells we tested showed no leak at all. Of the 74 leaks, 39 were the small ones we could not rate, and among the 35 that have a rate, the largest 8 carry half the methane. The skew is mostly leaking against not leaking, and then a handful of larger leaks against many small ones.

The leaks themselves are small
Across the 52 Oklahoma leaks we have a rate for, the median is 27.5 litres of methane per minute (LPM). This count includes 17 leaks found on our earlier trips, which the concentration figures leave out, and it leaves out the 39 leaks too small to rate, so the typical leak we find is smaller still. That median is about 1.1 kg of methane an hour, or 1.4 thousand cubic feet a day (MCF/d) for readers who think in gas sales. The middle half runs from about 0.5 to 2 kg an hour, 48% are under 1 kg an hour, and every one is under 10 MCF/d.
Methane traps about 80 times more heat than CO2 over its first 20 years, so a leak this size is worth stopping. However, it is not large as methane sources go. Typical oil-and-gas plumes in the Carbon Mapper satellite catalogue over Oklahoma run about 200 to 670 kg an hour, a few hundred times our median leak. At this scale a leaking orphaned well has to be found on the ground.
Finding the few is most of the work
If about 2% to 3% of tested wells hold most of the methane, a survey program is worth roughly what its ranking is worth. The useful question is whether anything in the public record tells us, before the truck leaves, which wells those are. We have spent much of the past year trying to answer it, and most of the signals we expected to work did not hold up.
With a few dozen to about a hundred leaks in a cohort, almost any pattern looks real for a while. Two wells landing in one category can move a rate by several points, and leaks near each other share geology, operators and the same survey trip. So a signal that looks promising goes through stricter tests before it changes a route. We refresh the labels and run it again on wells surveyed since. We run spatial-block cross-validation: the state is cut into blocks about 35 miles across, and a model trained on some blocks is scored on blocks it never saw, so it cannot do well by memorizing a neighborhood. We replay it prospectively, asking whether the rule would have predicted the wells tested after it was written down. And we set aside the 17 leaks we knew about before discovery surveying began, because they were not found the way new leaks are.

What we tested, and what was left of it
Distance to active producers came first. The idea is physical: too close to a producing well and the reservoir is drawn down, too far and there is no gas to leak. Wells 1 to 2 miles from an active producer first appeared to leak at about four and a half times the odds of the rest. That figure came from a cohort we could not later rebuild. On refreshed Oklahoma labels the effect fell to an odds ratio of 1.47 (p = 0.40), one field trip found its leaks in a nearer ring instead, and in four spatial cross-validation tests it added no held-out improvement, even though the model leaned on it heavily. A feature a model uses a lot, and which still adds nothing on ground it has not seen, is being fitted rather than learned.
Leaks do cluster. On the discovery cohort we count 9 pairs of leaking wells within 1 km of each other, against 3.6 expected if leaks were shuffled among the wells we tested in the same county, and 16 pairs within 3 km against 7.5. The obvious move is to send the crew next door whenever they find one. Replayed prospectively, though, wells tested after a leak was found within 2 km leaked at 9.1%, against 7.9% for wells in the same county that were not (p = 0.77). Only 44 wells qualified, so the test is weak in both directions. For now the clustering describes where leaks have been; it has not yet told us where the next one is.
Fluid composition looked like the best signal we had. Wells recorded as gas, condensate, or wet or dry gas first leaked at about twice the odds of oil wells, which fits measurements made in Pennsylvania (Kang et al., PNAS 2016). With the 17 known-before leaks set aside, the direction holds but the interval crosses one: 7.8% against 6.1%, an odds ratio of 1.3 (95% CI 0.8 to 2.2). It also added no measurable skill once it sat inside the model with everything else.
With depth, the deepest quarter of wells first leaked at about twice the rate of the rest. The 17 known-before leaks are mostly deep, and depth is recorded on some wells far more often than others. On discovery surveys alone the difference is not significant (odds ratio 1.49, 95% CI 0.77 to 2.90), and depth had already failed as a straight-line trend.
Some signals never looked real. The 83,725 historical completion-test pressures we located showed no relationship with leaks (rho 0.046, p = 0.24), which is unsurprising for readings that are mostly decades old. Terrain we tested against a different question, whether a truck reaches the well at all. Slope, a standard ruggedness index and land cover made no difference (permutation p 0.49 to 0.81). What stops a truck is gates, mud and regrowth, none of which shows up in an elevation model.
These came out of screening many candidate signals, and none of them survives a correction for that many tries.
The model is modestly better than chance
Put together, the public record does carry some signal. On regions it never saw in training, the tenth of wells our model ranks highest leak at roughly 1.9 to 2.2 times the average rate, depending on whether the known-before leaks are counted, and its ROC-AUC is about 0.6, where 0.5 is a coin toss. That is across 1,753 surveyed Oklahoma and Texas wells with 121 leaks. We hold a model to twice the average rate, with and without the known-before leaks, before it ranks wells on its own, and this one has not cleared that bar. So our routes are still built from a few simple rules on the public record, and every trip includes unplanned wells checked along the way as a control, so a rule that stops working shows up in the field.
The largest single gain this year came from the data. When we refreshed it, adding 236 labeled wells and 14 leaks, the model's held-out ROC-AUC rose from 0.567 to 0.600, more than any candidate signal moved it. At this number of leaks, better and more labels are worth more than cleverer features. That is why our field app is built to record the access outcome, the instrument reading, video and a voice note at every stop, and why we count a well as tested only when a crew reached a wellhead that exists. How we find and measure wells is set out on How we work.